Statistical Modeling for Credit Default: Assumption Testing and Logistic Regression
Purpose of the Analysis
This analysis aims to identify key factors contributing to credit card defaults and develop a predictive model to classify customers as likely to default. A default occurs when a customer fails to make required payments, leading to financial losses for banks and lenders.
Using data from the University of California, Irvine Machine Learning Repository, which includes credit card client data from Taiwan, this study examines factors such as:
Financial attributes: Credit amount, past payment history, billing amounts, and prior payments over six months.
Demographic characteristics: Age, gender, education, and marital status.
The primary research questions driving this analysis are:
What are the strongest indicators of default risk?
Can a statistical model accurately classify customers as likely to default?
How effective is the model in predicting default?
By answering these questions, this analysis aims to enhance financial institutions' risk assessment, improve lending decisions, and develop proactive strategies to identify and support at-risk customers.
Dataset Overview
This analysis utilizes a dataset of 30,000 credit card clients in Taiwan, collected from a financial institution to study default risk. The dataset includes 24 variables:
23 explanatory variables covering demographics, credit history, and payment behavior
1 target variable indicating whether a customer defaulted (1 = Yes, 0 = No)
The dataset is complete, with no missing values, and consists of a mix of categorical, ordinal, and continuous variables.
Additional Features
1. Credit Utilization Ratio
This feature measures how much of a customer's available credit is being used. It is determined by comparing the total bill amount over the last six months to the total payments made, relative to the customer’s credit limit. A higher utilization ratio may indicate greater financial strain and a higher risk of default.
2. Average Payment Delay
This feature captures the overall payment behavior of a customer by averaging their past payment statuses over six months. Since payment status is recorded on an ordinal scale, this metric helps summarize whether a customer tends to pay on time, with slight delays, or has a history of prolonged missed payments.
Data Preprocessing
Before building the predictive model, the dataset undergoes several preprocessing steps to ensure data integrity, assumption validation, and model efficiency.
1. Data Cleaning and Formatting
Column names are standardized for consistency.
Missing values are checked, and none are found.
Categorical variables, including sex, education, marital status, and default status, are converted into factor variables to ensure proper model interpretation.
2. Checking for Duplicate Records
To maintain the assumption of independence of observations, duplicate entries are identified. No duplicates were found, confirming that each record represents a unique individual.
3. Outlier Detection and Removal
Outliers in continuous variables such as credit limit, age, bill amounts, and payment amounts are identified using Cook’s Distance, a statistical measure of influence.
Any observation with a Cook’s Distance exceeding a set threshold is removed to ensure the model is not overly influenced by extreme values.
4. Model Simplification through Stepwise Selection
A stepwise selection process is applied to refine the logistic regression model and improve interpretability.
The selection process suggests that age does not significantly contribute to predicting default, leading to its removal.
The final model achieves a minimal improvement in the Akaike Information Criterion (AIC), indicating that while both the full and reduced models perform similarly, the simplified model is preferred for efficiency.
By carefully cleaning, validating, and optimizing the dataset, this preprocessing approach ensures that the final model is both robust and interpretable, enhancing its ability to predict credit card default risk effectively.
Assumption Validation
Before refining the model, a baseline logistic regression model was created using all available features. This model serves as a reference point for evaluating improvements.
1. Baseline Model Performance
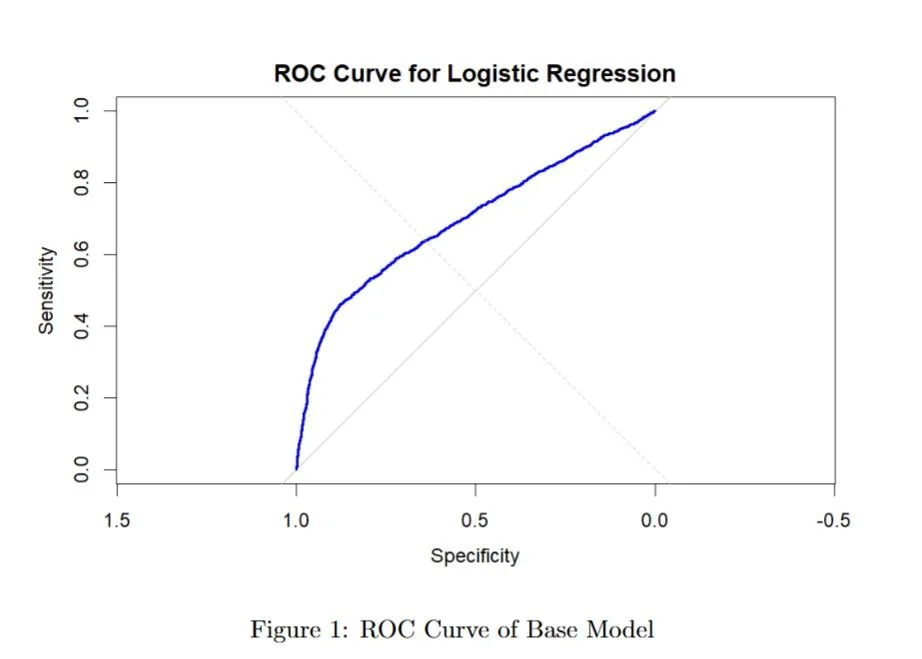
Hosmer-Lemeshow Goodness-of-Fit Test: The test returned a χ² value of 208.09 (df = 8, p-value < 2.2 × 10⁻¹⁶), indicating a significant lack of fit, suggesting the model does not fully capture the relationship between predictors and default probability.
AUC Score: The model achieved an AUC of 0.6957, meaning it has moderate predictive performance—better than random guessing but not highly effective.
Accuracy: The initial model reached 64.75% accuracy, highlighting room for improvement.
Assumption Checks and Adjustments
1. Independence of Observations
Independence was validated by checking for duplicate records.
Since all records represent unique customers, the assumption was satisfied.
2. Absence of Multicollinearity
Variance Inflation Factor (VIF) was used to assess multicollinearity.
Some predictors, particularly bill statement amounts, payment amounts, and payment behavior, had VIF values above 5, indicating high multicollinearity.
To address this, two aggregate features were created:
Credit Utilization Ratio
Average Payment Delay
These new features replaced highly correlated variables, reducing multicollinearity while retaining essential information.
3. Linearity in Log-Odds
The Box-Tidwell test was performed to check whether continuous variables had a linear relationship with the log-odds of default.
Results:
Credit Limit (LIMIT_BAL) violated the assumption (p < 2 × 10⁻¹⁶), indicating the need for a log transformation to better capture its relationship with default probability.
Age (AGE) followed a linear relationship (p = 0.5413) and did not require transformation.
4. Goodness of Fit
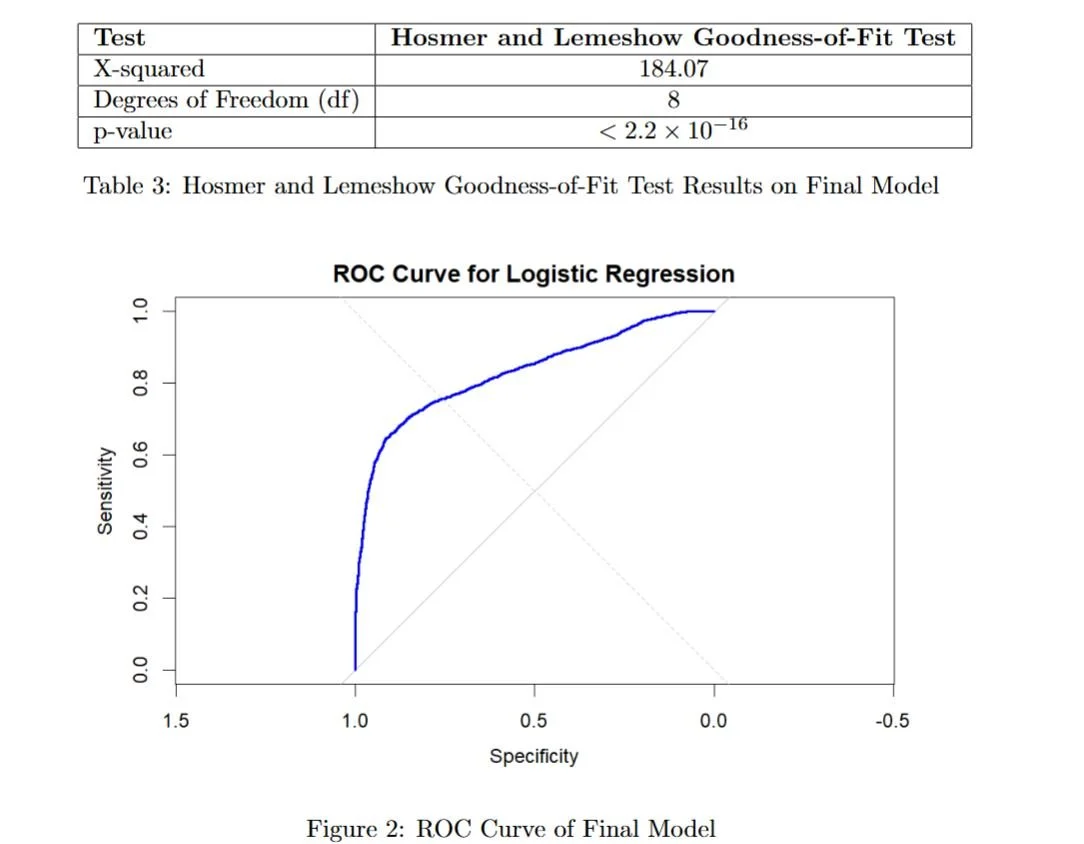
The Hosmer-Lemeshow test for the updated model (χ² = 184.07, df = 8, p < 2.2 × 10⁻¹⁶) still indicated a lack of perfect fit.
However, the AUC improved to 0.8319, demonstrating a stronger ability to differentiate between default and non-default cases.
Model Creation
The final logistic regression model was developed after refining the dataset and validating key assumptions. The model incorporates four key predictors, selected based on their statistical significance and contribution to improving predictive performance.
Performance Evaluation
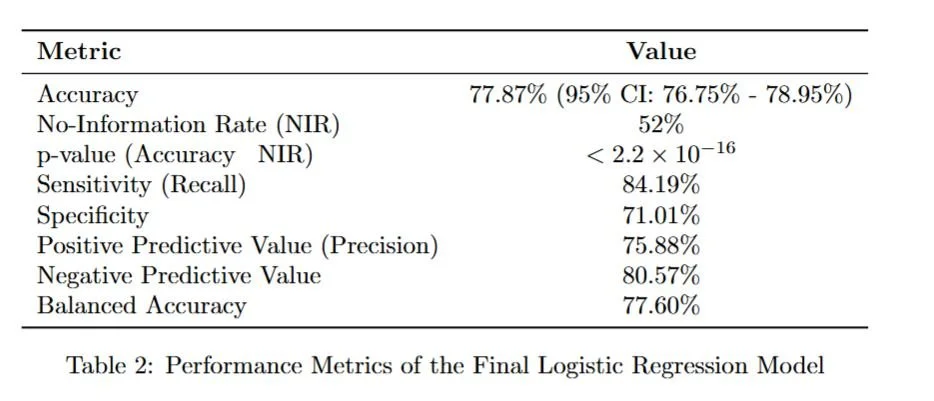
The final logistic regression model demonstrates strong predictive performance, significantly outperforming random guessing and effectively distinguishing between defaulters and non-defaulters.
1. Model Accuracy
Accuracy: 77.87% (95% CI: 76.75% - 78.95%)
This represents a substantial improvement over the no-information rate of 52%.
The p-value (< 2.2 × 10⁻¹⁶) confirms that the model’s predictions are statistically significant and not due to random chance.
2. Classification Metrics
Sensitivity (84.19%) – The model effectively identifies non-defaulters, meaning most customers who do not default are correctly classified.
Specificity (71.01%) – The model reasonably detects defaulters, though with slightly lower precision.
Positive Predictive Value (75.88%) – When predicting a customer will not default, the model is correct about 76% of the time.
Negative Predictive Value (80.57%) – When predicting a default, the model is correct 81% of the time.
Balanced Accuracy (77.60%) – The model maintains a well-balanced performance across both classes.
3. Model Fit and Limitations
The Hosmer-Lemeshow Goodness-of-Fit test (χ² = 184.07, df = 8, p < 2.2 × 10⁻¹⁶) suggests that while the model differentiates well between default and non-default cases, it does not perfectly fit the data.
This indicates room for further improvement, such as incorporating additional non-linear relationships or exploring alternative modeling techniques. However, the area under the curve (AUC = 0.8319) shows that the model is good at distinguishing between defaulters and non-defaulters.
Conclusions
This analysis identified key factors influencing credit card default risk and evaluated the effectiveness of a logistic regression model in predicting default. The results highlight the strongest predictors, the model’s classification ability, and its overall accuracy.
1. What Are the Strongest Indicators of Default?
The final logistic regression model identifies four key predictors of default, all with high statistical significance (p < 2 × 10⁻¹⁶):
Most Recent Payment Status (PAY0) – A higher payment delinquency increases the odds of default.
Average Payment Delay – Customers with longer historical payment delays are at higher risk.
Credit Utilization Ratio – Higher utilization correlates with lower default risk.
Log-Transformed Credit Limit (LIMIT_BAL log) – Higher credit limits are associated with lower default risk.
Odds Ratio Interpretation:
PAY0 (Odds Ratio ≈ 2.19): Each unit increase in delinquency more than doubles the odds of default.
Average Payment Delay (Odds Ratio ≈ 2.01): Each additional unit of delay doubles the odds of default.
Credit Utilization Ratio (Odds Ratio ≈ 0.90): A one-unit increase in utilization reduces default odds by 10%.
Log-Transformed Credit Limit (Odds Ratio ≈ 0.68): A higher credit limit reduces default odds by 32%.
These results indicate that recent and historical payment behavior have the most substantial impact on default risk, while credit limit and utilization provide additional financial context.
2. Can the Model Effectively Classify Customers as Likely to Default?
The model exhibits strong discriminatory power, with an AUC of 0.8319, indicating that it effectively distinguishes between defaulters and non-defaulters.
Model Performance:
Accuracy: 77.87% (compared to the no-information rate of 52%)
Sensitivity: 84.19% (correctly identifying non-defaulters)
Specificity: 71.01% (correctly identifying defaulters)
Positive Predictive Value: 75.88% (76% of predicted non-defaulters are correctly classified)
Negative Predictive Value: 80.57% (81% of predicted defaulters are actual defaulters)
Balanced Accuracy: 77.60%
These metrics confirm that the model performs well across both default and non-default classifications.
Potential Improvements:
While the model is effective, incorporating additional financial factors—such as debt-to-income ratio and credit utilization across all financial obligations—could enhance its predictive power. Also, a bank might prefer a high specificity model (to minimize false positives and avoid denying loans to creditworthy individuals) while a credit risk management team might prefer a high sensitivity model (to catch as many potential defaulters as possible, even if some are incorrectly classified). The model’s threshold could be adjusted to balance these competing priorities to make our analysis more impactful.
3. How Accurate Is the Model’s Prediction?
The model achieves a strong accuracy of 77.87%, significantly outperforming the no-information rate of 52%.
Sensitivity (84.19%) confirms that the model correctly identifies most non-defaulters.
Specificity (71.01%) indicates it reasonably detects defaulters.
Balanced Accuracy (77.60%) further supports that the model maintains a well-balanced classification performance.
Overall, the model provides a reliable method for predicting default risk, making it a valuable tool for financial decision-making and risk management.


